

Which ETF is the Best?
- Subscribe to my YouTube Channel HERE.
Lists are naturally interesting and are tried-and-true methods of getting clicks.
Even if they end up being disappointments.
But I've just spent a lot of time on a new spreadsheet, and the goal of this spreadsheet was to answer one question:
Which ETF is best?
Of course, there are a lot of ways to judge this. But to me, there's really only one way.
I want to know which ETF produces the most return for the least amount of risk. I don't care if something has a 100% return if the potential max drawdown is 99%. That's just bad gambling.
But I do care about an ETF that produces a 100% return for a small or moderate amount of risk. That's something I'd be willing to put a lot of money into.
So, how do we get a ranking that incorporates risk-adjusted returns?
We can use the Sortino Ratio.
What's the Sortino Ratio? It's a ratio that measures how much return we get while looking at how much downside risk we have to take on.
In short, we want our stocks or ETFs to have a Sortino Ratio over 1.0.
We actually would like it as high as possible (within reason) because a high number means that an ETF is getting a lot of return for a small amount of pain.
And this ratio also allows us to do a ranking list.
The highest Sortino Ratio is the winner.
What are the potential problems?
The biggest problem with this ranking is if we don't have enough data. If something's been around less than a year, then there hasn't been enough time to see this ETF go through some downside difficulties. But if we have enough data, we can say that one ETF is better than another (if we care about risk).
So, let's get to it.
First, we'll go back many years. For this ranking, we'll look at ETFs that have been around since 2004.
Remember, we don't care how much they made. We care about how much they made without taking on a massive amount of risk.
Going back to 2004, here is the growth ETF list:

And the winner since February 2004 is...
QQQ.
It's better (on a risk-adjusted basis) than VGT or the financial advisors' dream, SPY. It's the best bang-for-our-buck.
What about in recent times?
Here's that same list since January 2020:
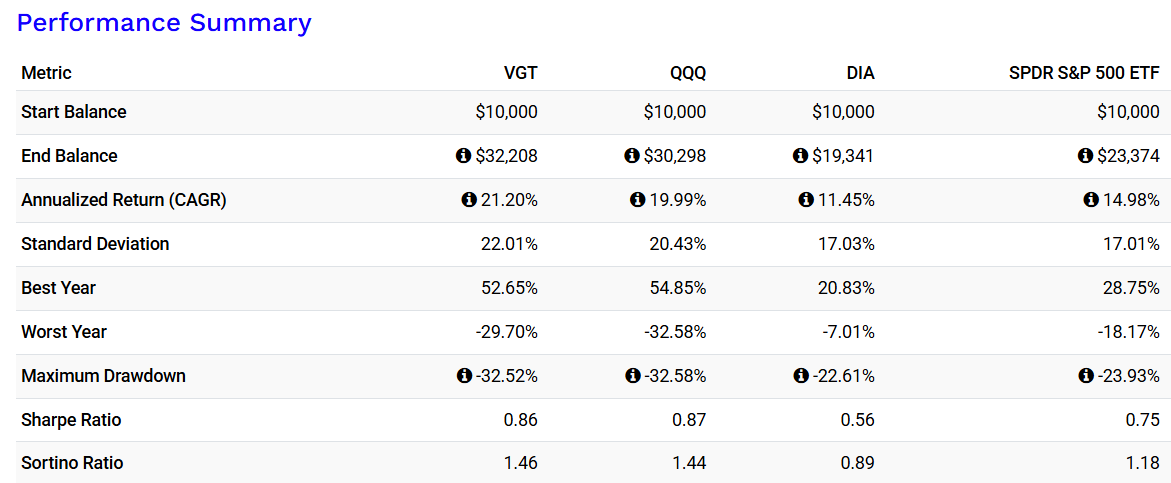
If we go back about six years, then VGT is the winner. It squeaked out a narrow victory over QQQ. But both have put up some great returns.
What's interesting to me is how SPY falls short in both comparisons. Yes, it has less drawdown, but it also ends up giving less on the upside. It seems like tech has been been better for a long time now.
So, what would I choose from this group if I had to choose tomorrow? What would I be willing to put $1,000 in each month?
I would choose VGT.
And I would choose it over any individual stock.
What about all the income ETFs? How do they stack up?
Well, as I mentioned, I've just spent a lot of time working on a spreadsheet that lists 66 different income and growth ETFs. I have the yield, annual returns, max drawdowns, and Sortino Ratios on all of them.
And that list is accessible by becoming a DIP Member here.
But if you're curious, the best income ETF (using this method) that isn't a single stock ETF is...
SOXY (by Yieldmax).
Again, to get the entire list, you can join the DIP program here.
Talk to you soon.
DISCLAIMER: This is not financial advice.
It should not be assumed that the methods, techniques, or indicators presented in these videos will be profitable or that they will not result in losses. Past results are not necessarily indicative of future results. Examples presented are for educational purposes only. These set-ups are not solicitations of any order to buy or sell. The authors, the publisher, and all affiliates assume no responsibility for your trading results. There is a high degree of risk in trading. HYPOTHETICAL OR SIMULATED PERFORMANCE RESULTS HAVE CERTAIN INHERENT LIMITATIONS. UNLIKE AN ACTUAL PERFORMANCE RECORD, SIMULATED RESULTS DO NOT REPRESENT ACTUAL TRADING. ALSO, SINCE THE TRADES HAVE NOT ACTUALLY BEEN EXECUTED, THE RESULTS MAY HAVE UNDER- OR OVER-COMPENSATED FOR THE IMPACT, IF ANY, OF CERTAIN MARKET FACTORS, SUCH AS LACK OF LIQUIDITY. SIMULATED TRADING PROGRAMS IN GENERAL ARE ALSO SUBJECT TO THE FACT THAT THEY ARE DESIGNED WITH THE BENEFIT OF HINDSIGHT. NO REPRESENTATION IS BEING MADE THAT ANY ACCOUNT WILL OR IS LIKELY TO ACHIEVE PROFITS OR LOSSES SIMILAR TO THOSE SHOWN.

